FROM
FROM (2022)
Currently #1 trending in United States
Executive Summary
AI-generated performance analysis
Excellent
This TV series achieves a A (Excellent) trending performance rating, currently #1 trending.
"FROM" (2022) demonstrates exceptional trending performance on TMDB trending charts.
The series has been trending for 103 days, including 54 days at the #1 position and 98 days in the Top 10.
- Peak: #1
- Current: #1
- 103 days trending
- 8.5/10 rating
Key Insights
AI-generated analysis based on trending performance
#1 Trending Achievement
This show reached #1 trending and held that position for 54 days. Only ~5% of trending content in United States achieves this milestone.
Exceptional Trending Longevity
103 days on the trending list (7.4x the average show) demonstrates sustained audience interest well beyond typical performance.
Surging Up the Charts
Climbing 8 positions to #1 indicates rapidly growing viewer interest. This momentum often precedes peak trending position.
Critically Acclaimed
With a 8.5/10 rating from 4,077 votes, this show is exceptionally well-received by audiences, placing it in the top 10% of rated content.
Trending Performance Factors
Key metrics driving this TV show's trending success
Trending Performance
Peak position on trending charts
- Peak position: #1
- Peak date: Apr 23, 2026
- 54 days at #1
- 86 days in Top 3
- Currently ranked #1
Chart Longevity
Duration on trending charts
- 10.3x longer than average TV show
- 103 total days trending
- 103 consecutive days
Audience Score
TMDB user rating
- TMDB Rating: 8.5/10
- 4,077 votes
- Highly acclaimed by audiences
Current Momentum
Recent trending movement
- Stable trending position
- Consistent audience interest
- Recent change: +8
Exceptional performance with strong metrics across all factors.
Category Benchmark
Performance compared to other trending TV shows
1.8x higher than avg
10.3x higher than avg
1.2x higher than avg
24.5x higher than avg
Strong performance, outperforming most trending TV shows content.
Trending History & Insights
Performance over time
Currently ranked #9 in the Top 10. Peak was #1. Ranking is stable. Spent 89 days in Top 10.
Peak reached on Jul 10, 2026
TV Show Info
TV Shows Reference
Source content being analyzed
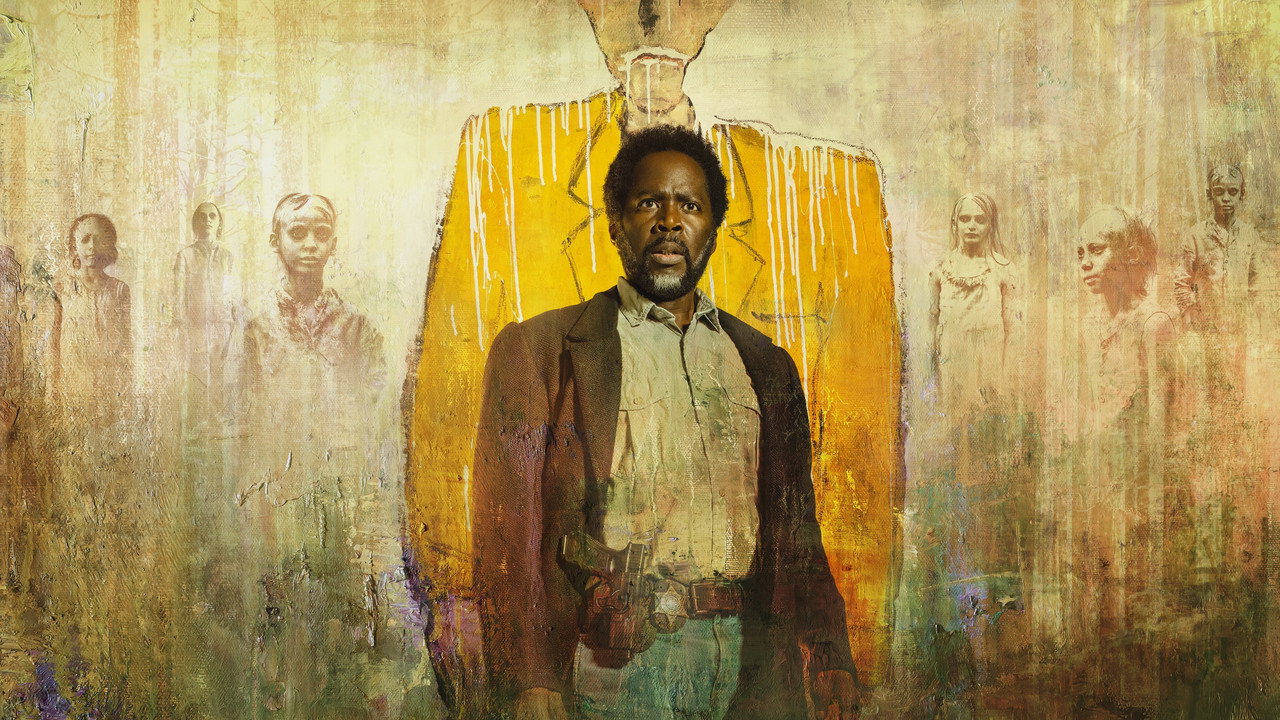
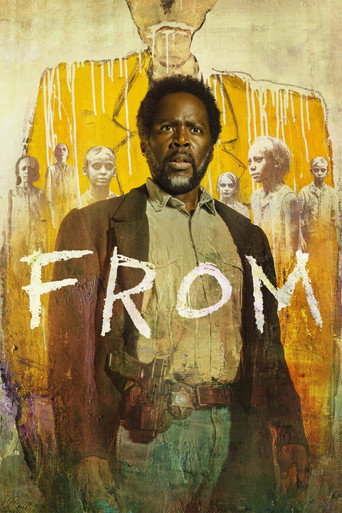
FROM
Unravel the mystery of a nightmarish town in middle America that traps all those who enter. As the unwilling residents fight to keep a sense of normalcy and search for a way out, they must also survive the threats of the surrounding forest – including the terrifying creatures that come out when the sun goes down.


About This Analytics Report
This report is generated by Top1Trend's analytics engine, which tracks TMDB trending data across 20+ regions since 2024. All metrics are derived from movie & tv trending data via the official TMDB API.
Top1Trend is an independent analytics service and is not affiliated with, endorsed by, or sponsored by TMDB. All trademarks belong to their respective owners. Data accuracy depends on platform API availability and may have slight delays from real-time values.